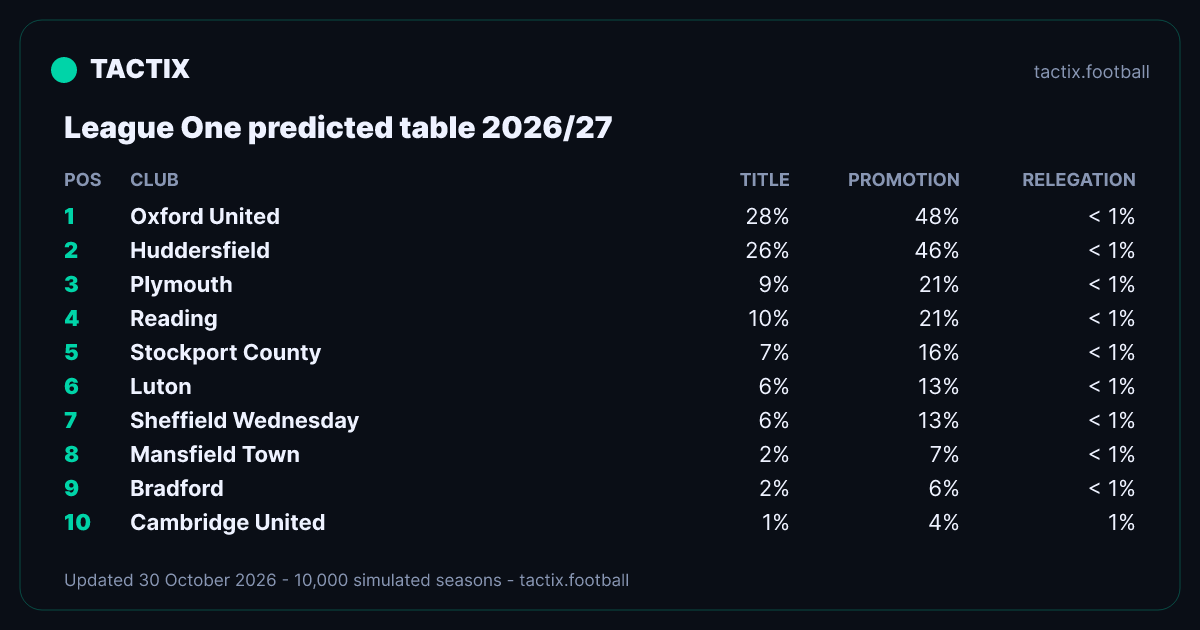
As of 30 October 2026, TACTIX’s 10,000-run simulation gives Oxford United a 28% chance of the title and Huddersfield 26%. Bromley are the most likely to go down (94%). The table re-runs as results land; the model’s record is on the scoreboard.
| Pos | Club | Median finish | Proj. pts | Title | Promotion | Relegation | Move |
|---|---|---|---|---|---|---|---|
| 1 | Oxford United | 3 | 82 | 28% | 48% | < 1% | – |
| 2 | Huddersfield | 3 | 81 | 26% | 46% | < 1% | ▲ |
| 3 | Plymouth | 5 | 77 | 9% | 21% | < 1% | – |
| 4 | Reading | 5 | 76 | 10% | 21% | < 1% | – |
| 5 | Stockport County | 6 | 75 | 7% | 16% | < 1% | – |
| 6 | Luton | 6 | 74 | 6% | 13% | < 1% | – |
| 7 | Sheffield Wednesday | 6 | 74 | 6% | 13% | < 1% | – |
| 8 | Mansfield Town | 8 | 71 | 2% | 7% | < 1% | – |
| 9 | Bradford | 8 | 71 | 2% | 6% | < 1% | – |
| 10 | Cambridge United | 9 | 69 | 1% | 4% | 1% | – |
| 11 | Leicester | 10 | 68 | 1% | 3% | 1% | – |
| 12 | Wycombe | 12 | 65 | < 1% | 1% | 2% | – |
| 13 | Stevenage | 14 | 61 | < 1% | < 1% | 5% | – |
| 14 | Burton Albion | 15 | 60 | < 1% | < 1% | 6% | – |
| 15 | Milton Keynes Dons | 16 | 58 | < 1% | < 1% | 9% | – |
| 16 | Leyton Orient | 16 | 57 | < 1% | < 1% | 12% | – |
| 17 | Blackpool | 17 | 56 | < 1% | < 1% | 15% | ▼ |
| 18 | Peterborough | 17 | 56 | < 1% | < 1% | 15% | – |
| 19 | Notts County | 17 | 56 | < 1% | < 1% | 15% | ▼ |
| 20 | Doncaster | 19 | 52 | < 1% | < 1% | 33% | – |
| 21 | Barnsley | 20 | 50 | < 1% | < 1% | 44% | ▼ |
| 22 | Wigan | 22 | 45 | < 1% | < 1% | 71% | ▲ |
| 23 | AFC Wimbledon | 22 | 44 | < 1% | < 1% | 77% | ▲ |
| 24 | Bromley | 24 | 38 | < 1% | < 1% | 94% | – |
Matchday: 27 October. The simulation of 30 October (10,000 simulated seasons) against the last one before the matchday, 27 October (10,000).
Club-by-club detail is in the League One hub. How the model is checked: the scoreboard.
Updated 30 October 2026 · 10,000 simulated seasons · how the model is checked: /scoreboard
Use this table: the table as an image (PNG) · embed it on your site (free, with the credit).
18+. TACTIX predictions are model-informed analysis, not betting advice or guarantees. Accuracy shown counts rated picks (≥70% confidence) only; calibration is ±0.5% mean calibration error across a 9M+-prediction track record (all markets, player markets included). Please gamble responsibly — BeGambleAware.org.